
A Quality Improvement Activity
Healthcare workers were facing a lot of challenges due to the COVID-19 pandemic which was eroding Joy in Work. They were dealing with burnout, stress, and low morale, while there weren’t enough staff, and the pressure to handle the pandemic pilled on. It’s important to acknowledge these issues and focus on creating a workplace that works well while keeping patient safety a top priority.
Patel and Thomas (2021) suggested a three-pronged approach to guide post-pandemic recovery for the healthcare system, which involved recovering from the pandemic’s impact, rewarding healthcare workers for their efforts, and renewing the healthcare system.
One way to demonstrate our commitment to recovering from the pandemic was by collecting real-time feedback from staff using a structured tool. To improve joy in work for healthcare workers, we must start by addressing fatigue, burnout, and mental health problems – this is the first part of the approach. Our team aimed to generate a local solution to the challenges of a stressful work environment.
Project Planning
We brainstormed some ideas to execute this project, which included providing posters as visual management tools to remind staff to give feedback daily, registering the project with the Quality Improvement Office Team, and creating an A3 poster and fishbone diagram to demonstrate the root causes of low joy in work.
Our goal was to see an overall 50% increase in joy in work within 12 months, as well as conducting monthly pulse surveys to assess staff engagement while ensuring that we did not impose any excessive administrative burden on staff.
We hoped that an initial staff survey analysis would help us identify areas for improvement and guide our efforts to create a workplace that supported, rewarded, and fulfilled healthcare workers. See our article on how to leverage digital platforms for real time feedback.
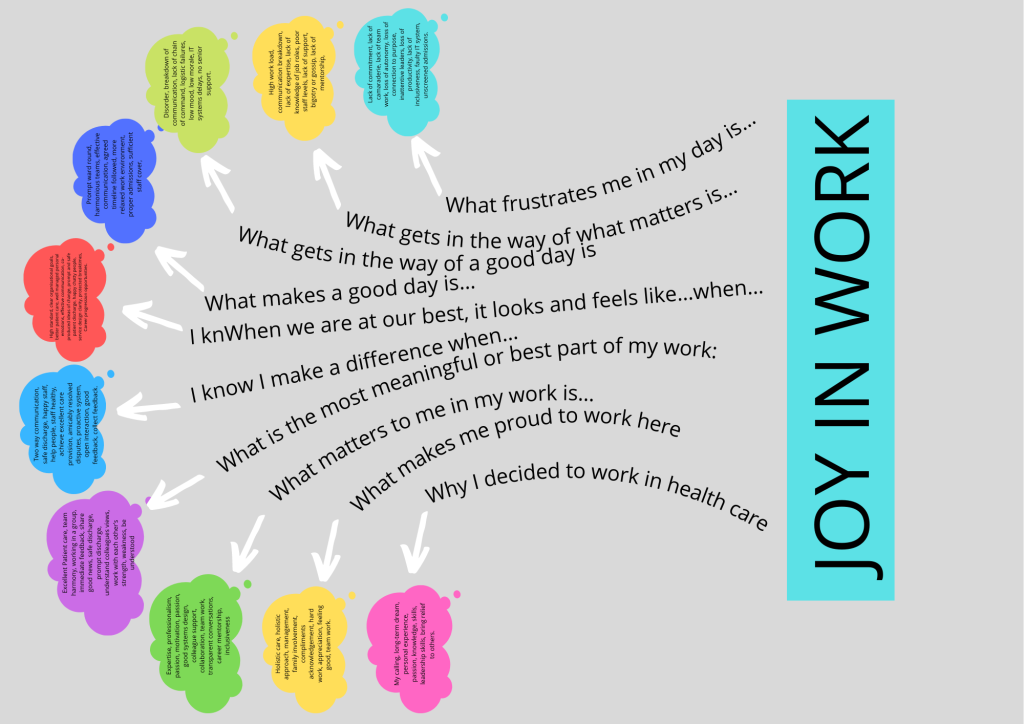
A3 POSTER
An A3 is a visual tool to conceptualise your project. We used this to capture the initial ideas, performed root cause analysis and itemised a proposed improvement plan.

FISHBONE DIAGRAM SHOWING ROOT CAUSE FOR LOW JOY IN WORK

FAMILY OF MEASURES
Outcome Measures: 50 % increase in Joy in work in 12 month time
Process measure: monthly pulse survey to assess staff engagement
Balancing Measure: Limit administrative burden for staff.
Initial staff survey analysis
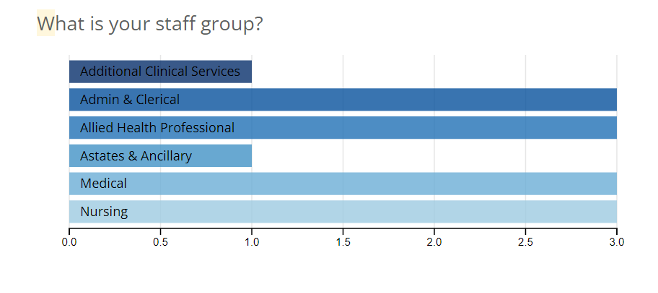
We deployed and collected feedback using the staff engagement questionnaire. The responders were spread across the 5 staff groups as shown below.
Staff engagement Interpretation

Four out of fourteen employees had high scores ranging from 48-60, suggesting they were highly engaged.
Five out of fourteen employees had neutral scores ranging from 36-47, indicating they were neither engaged nor disengaged.
Additionally, five out of fifteen employees had low scores ranging from 12-35, signifying they were disengaged.
The project aimed to increase the percentage of highly engaged staff by 50% over a 12-month period, which was deemed an achievable goal.
Utilising Maslow’s hierarchy of needs to map a staff engagement questionnaire allowed for the interpretation of results in terms of which needs were met or not met for employees.
For instance, low scores on physiological needs questions might suggest struggles with basic necessities, while low scores on safety needs feedback could indicate feelings of insecurity in the workplace.
Similarly, low scores on love and belonging, esteem, and self-actualisation questions might reveal feelings of isolation, undervaluation, or lack of purpose, respectively. Such insights enabled the development of targeted interventions to address employee needs and enhance overall engagement and satisfaction.
Use this link below to complete a staff engagement survey and compare your staff engagement score with the ranges above.
https://forms.gle/LqiTy2z3rPCxXN5z8
If you are interested in learning more about how to do quality improvement click here to access this handbook : EVERYBODY CAN DO QUALITY IMPROVEMENT – A QI HANDBOOK FOR HEALTHCARE PROVIDERS
REFERENCES
Perlo, J. et al. (2017) ‘IHI framework for improving joy in work’, IHI White Paper, p. 42. [online pdf] Cambridge, Massachusetts: Institute for Healthcare Improvement. Available from: www.ihi.org (Accessed 28 March 2021)
Patel, P. and Thomas, C. (2021) ‘Recover, Reward, Renew: A post-pandemic plan for the healthcare Workforce’, [online pdf] Institute for Public Policy Research. Available from: www.ippr.org/research/publications/recover-reward-renew (Accessed 30 June 2021)